The Koch Snowflake was created by the Swedish mathematician Niels Fabian Helge von Koch. he used the Koch Snowflake to show that it is possible to have figures that are continuous everywhere but differentiable nowhere.
The Koch Curve
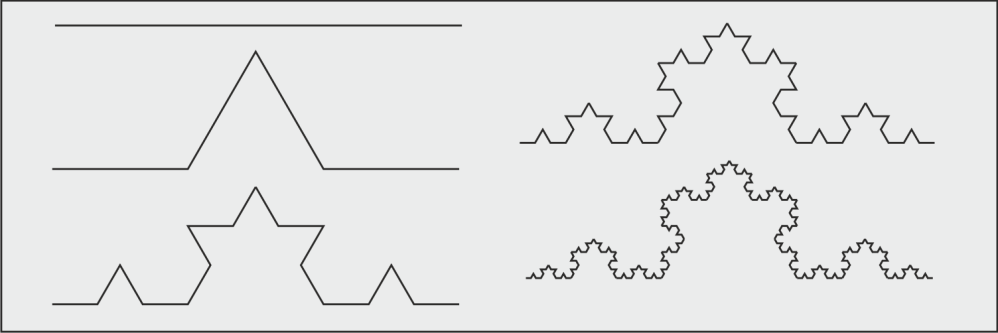
In order to create the Koch Snowflake, von Koch began with the development of the Koch Curve. The Koch Curve starts with a straight line that is divided up into three equal parts. Using the middle segment as a base, an equilateral triangle is created. Finally, the base of the triangle is removed, leaving us with the first iteration of the Koch Curve.
And Lets Implement with JavaScript and canvas
function drawLine(ctx, x1, y1, x2, y2, color) {

    ctx.fillStyle = "#000";
    ctx.strokeStyle = color;
    ctx.beginPath();
    ctx.moveTo(x1, y1);
    ctx.lineTo(x2, y2);
    ctx.lineWidth = 1;
    ctx.stroke();
    ctx.closePath();
}
function kochCurve(level, ctx, x1, y1, lenght, angle, color) {

    if (level === 0) {

        var x2 = x1 + lenght * Math.cos(angle);
        var y2 = y1 + lenght * Math.sin(angle);
        drawLine(ctx, x1, y1, x2, y2, color);

    } else {

        var x2 = x1 + lenght / 3 * Math.cos(angle);
        var y2 = y1 + lenght / 3 * Math.sin(angle);

        var theta1 = angle - Math.PI / 3;
        var theta2 = angle + Math.PI / 3;

        var x3 = x2 + lenght / 3 * Math.cos(theta1);
        var y3 = y2 + lenght / 3 * Math.sin(theta1);

        var x4 = x1 + lenght * 2 / 3 * Math.cos(angle);
        var y4 = y1 + lenght * 2 / 3 * Math.sin(angle);

        kochCurve(level - 1, ctx, x1, y1, lenght / 3, angle, 'red');
        kochCurve(level - 1, ctx, x2, y2, lenght / 3, theta1, 'blue');
        kochCurve(level - 1, ctx, x3, y3, lenght / 3, theta2, 'yellow');
        kochCurve(level - 1, ctx, x4, y4, lenght / 3, angle, 'brown');

    }

}
Invoke kochCurve function
var c = document.getElementById("canvas");
var ctx = c.getContext("2d");
var x1 = 20;
var y1 = 200;
var length = 300;
var angle = 0;
var depth = 3;

kochCurve(depth, ctx, x1, y1, length, angle, 'black');
When you Invoke with different depth you will see one of the below shape
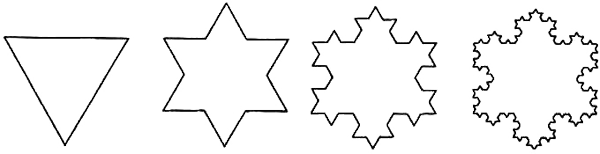
The Koch Snowflake
From the Koch Curve, comes the Koch Snowflake. Instead of one line, the snowflake begins with an equilateral triangle. The steps in creating the Koch Curve are then repeatedly applied to each side of the equilateral triangle, creating a “snowflake” shape.
To Implement Just write kochCurve function two time with 60 degree angle
var c = document.getElementById("canvas");
var ctx = c.getContext("2d");
var x1 = 20;
var y1 = 200;
var length = 300;
var angle = 0;
var depth = 3;

var x2 = x1 + length;

var x3 = x1 + length * Math.cos(Math.PI / 3);
var y3 = y1 + length * Math.sin(Math.PI / 3);

kochCurve(depth, ctx, x1, y1, length, angle, 'black');
kochCurve(depth, ctx, x2, y1, length, Math.PI * 2 / 3, 'black');
kochCurve(depth, ctx, x3, y3, length, -Math.PI * 2 / 3, 'black');when
When you Invoke with different depth you will see one of the below shape